Spring 2025 Market in Chatham County: Myths, Momentum & What the Data Actually Says
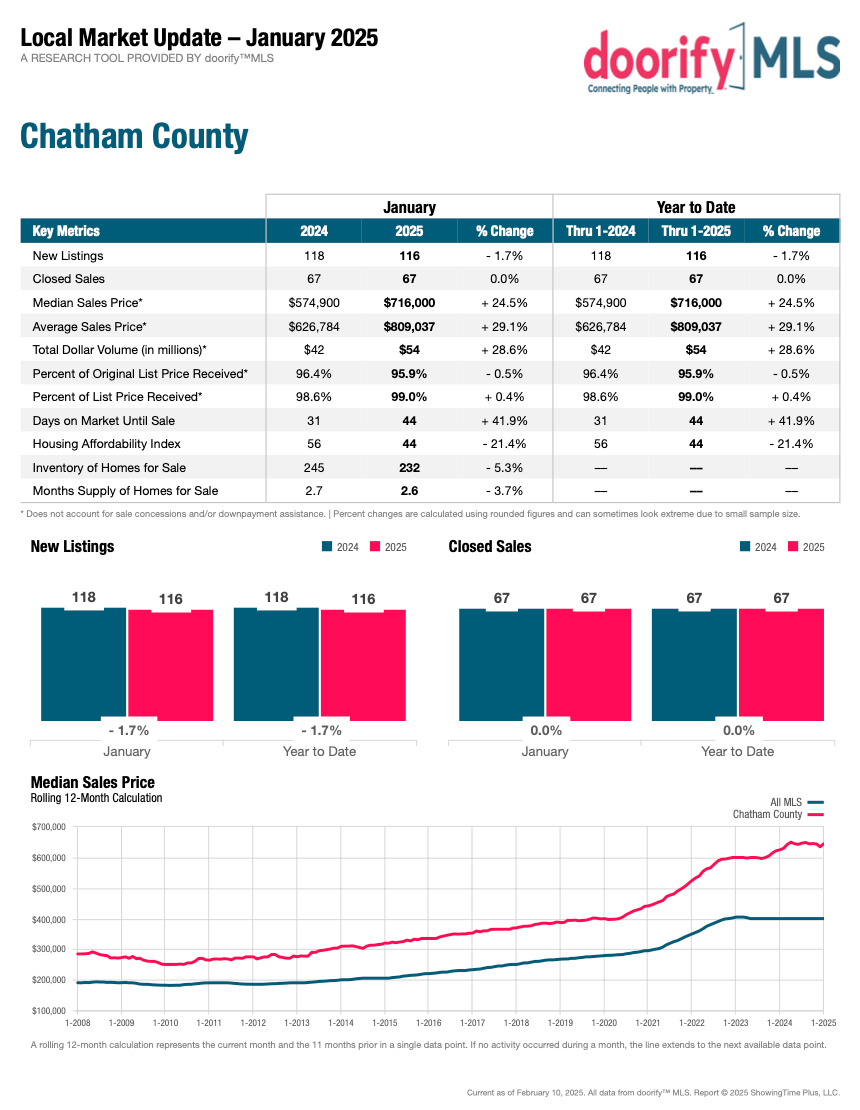
As the spring season kicks off, buyers and sellers alike are wondering what to expect from the Chatham County real estate market. Are prices still climbing? Are homes sitting longer? Are sellers reducing prices? We analyzed the latest data on homes for sale in Chatham County NC, focusing on single-family detached homes, to help you cut through the headlines and see exactly what’s happening this spring.
This report focuses specifically on single-family detached homes. Condos, townhomes, and multi-family units are not included.
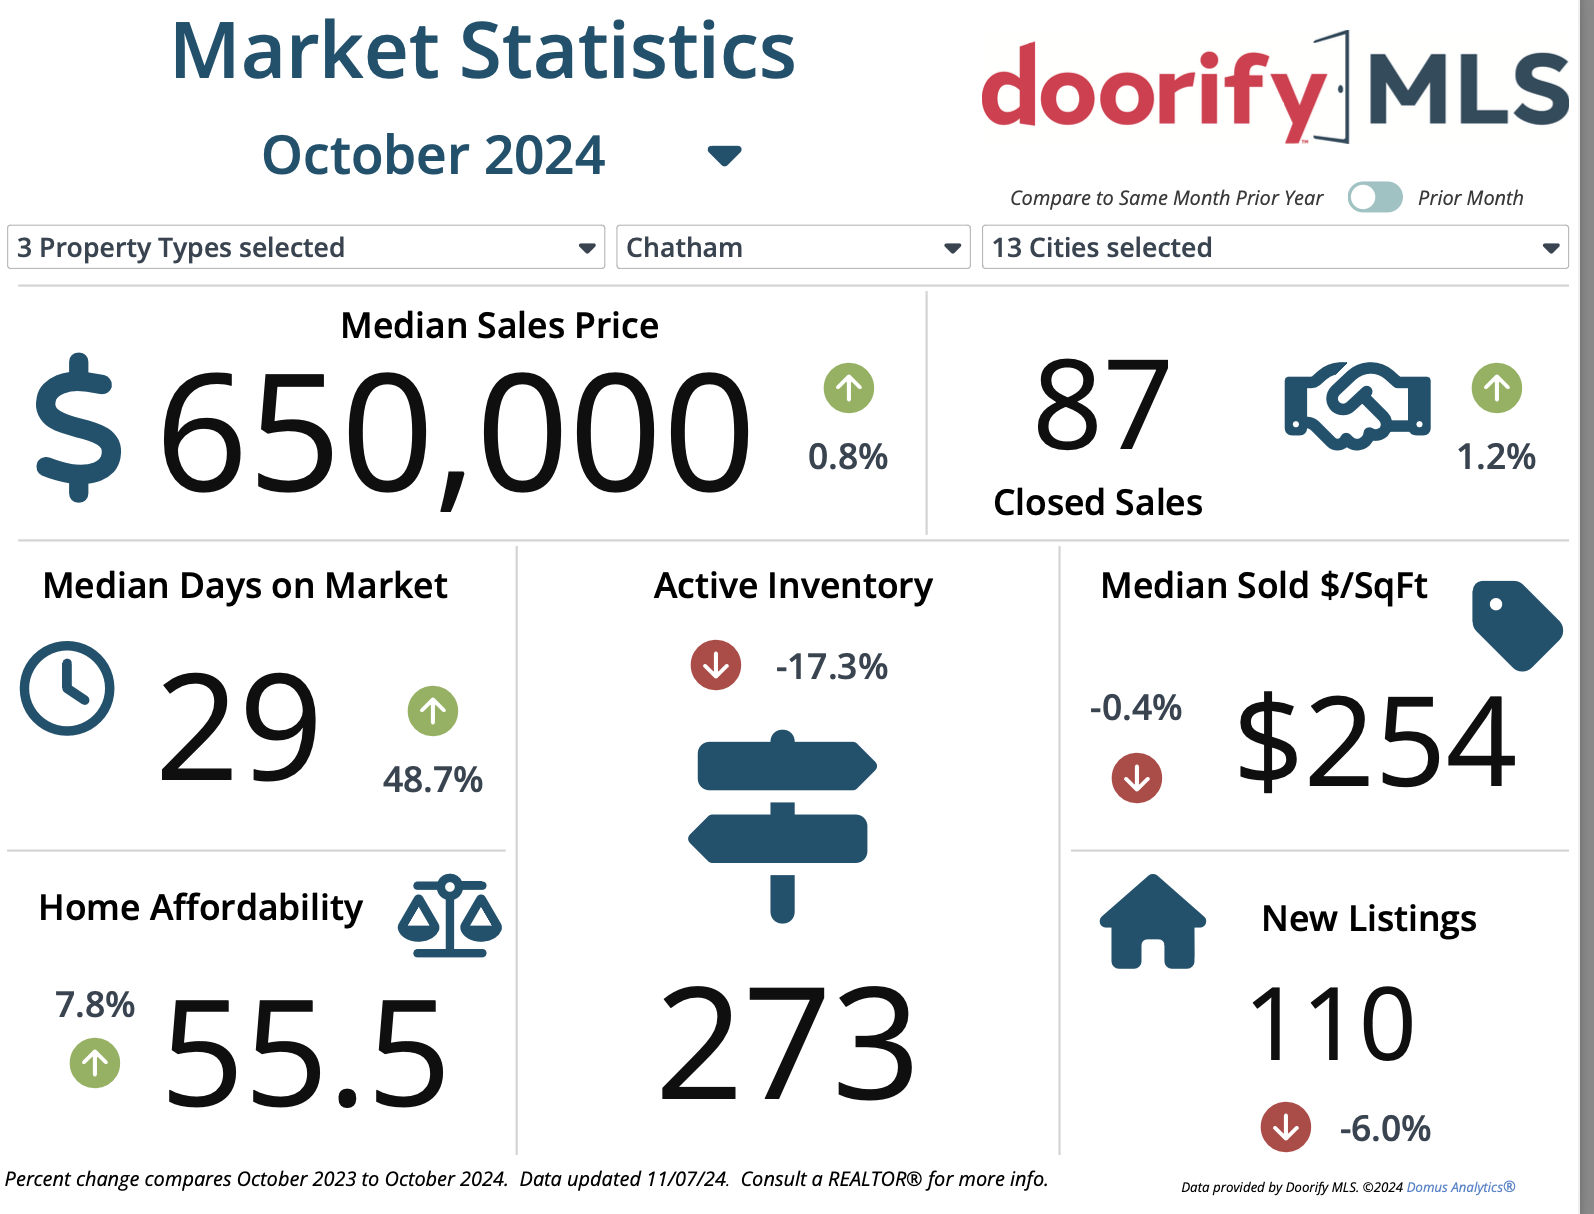
Using Doorify MLS (Triangle MLS) data from January through March (2022 to 2025), here’s your full breakdown of this year’s market compared to recent years.
Chatham NC Spring Market Trends: Jan–March (2022–2025)
| Year | Median List Price | Median Sale Price | Avg. DOM* | % with Pre-Contract Price Reductions | % Sold Below List |
|---|---|---|---|---|---|
| 2022 | $646,622 | $663,335 | 11.7 days | 2.3% | 17.1% |
| 2023 | $651,553 | $651,553 | 26.5 days | 4.9% | 44.1% |
| 2024 | $694,131 | $698,060 | 35.2 days | 29.5% | 47.1% |
| 2025 | $731,515 | $719,661 | 36.9 days | 15.9% | 7.1% |
* Average Days on Market (DOM) is calculated using resale homes only. New construction often reports 0 DOM until completion and is excluded from this metric.
** Pre-contract price reductions = homes where the list price was reduced before going under contract.
*** Sold below list = homes that closed below the final list price at time of offer.
What the Data Actually Shows (Spring 2025)
Prices are still climbing.
The median list price hit a new high of $731,515 in early 2025—up 12% since 2023.
Homes are taking longer to sell—on average.
Average DOM rose from 11.7 days in 2022 to 36.9 days in early 2025, showing that even with higher pricing, buyers are taking more time to act.
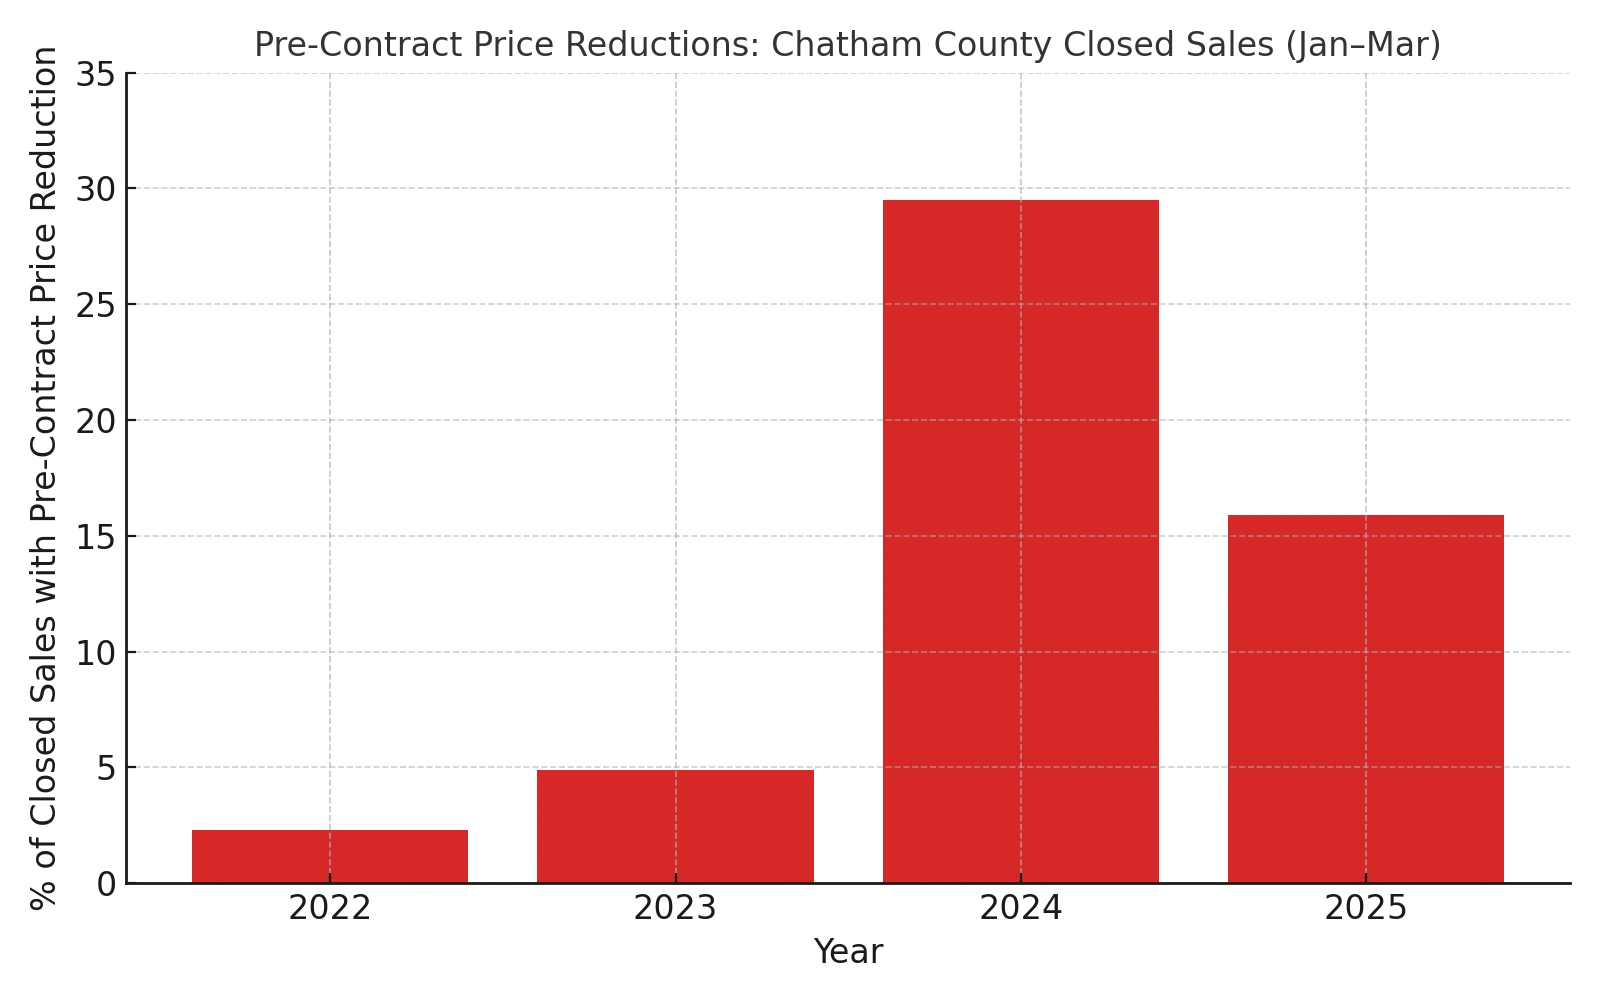
Price reductions are down—but still notable.
Only 15.9% of homes that closed in 2025 reduced their list price before going under contract, down from nearly 30% last year.
Buyer negotiation is limited.
Just 7.1% of homes in 2025 sold below their final list price—suggesting that sellers are pricing more effectively and holding firmer during negotiations.
The Real Cost of Overpricing in Chatham County NC
| Group | Average List-to-Sale Ratio |
|---|---|
| Priced Right (No Reduction) | 101.7% |
| Had to Reduce Before Offer | 97.7% |
Sellers who started at the right price often sold at or above asking.
Sellers who reduced price before getting an offer typically ended up selling for less than their already reduced price.
Takeaway: Pricing correctly from the beginning delivers stronger results and fewer days on market.
Myth vs. Market: What People Think vs. What’s Really Happening
| Common Belief | Reality Based on Data |
|---|---|
| Homes are sitting forever. | Average DOM has risen, but homes are still moving in under 40 days on average. |
| Everyone is slashing prices. | Price cuts peaked in 2024. Many 2025 listings are priced better upfront. |
| Buyers still have room to negotiate. | Only 7% of homes sold below list—sellers are holding firm. |
Understanding Price Reductions vs. Negotiation
Price Reduction
A seller-lowered listing price before accepting an offer.
Example: Listed at $750K → Reduced to $720K → Went under contract.
Sold Below List
A buyer negotiated a lower sale price after going under contract.
Example: Listed at $720K → Sold for $705K.
This distinction matters. Reductions reflect seller motivation or mispricing. Negotiations reflect buyer leverage. In 2025, both are tighter than in previous years.
New Construction vs. Resale: A Tale of Two Markets
The MLS treats Days on Market differently for new construction—often not counting time on market until completion. To provide clear insight, we’ve separated resale and new construction homes.
Resale Homes (616 closed sales)
| Metric | Value |
|---|---|
| Median List Price | $657,450 |
| Median Sale Price | $659,750 |
| Avg. DOM | 26.1 days |
| % with Pre-Contract Price Reductions | 11.9% |
| % Sold Below List | 43.2% |
| Avg. List-to-Sale Ratio | 101.1% |
New Construction Homes (245 closed sales)
| Metric | Value |
|---|---|
| Median List Price | $714,180 |
| Median Sale Price | $725,037 |
| Avg. DOM | 3.8 days* |
| % with Pre-Contract Price Reductions | 14.7% |
| % Sold Below List | 19.2% |
| Avg. List-to-Sale Ratio | 101.3% |
* DOM for new construction may be artificially low due to MLS practices that only begin counting once a home is completed or nearly move-in ready.
What This Means for You
For Sellers
The data shows that pricing right from the start is the smartest move. Most homes that sold quickly in 2025 did not reduce price or face heavy negotiation.
For Buyers
If you're expecting wide negotiation margins, you're chasing a 2023 market. That said, more listings are hitting the market this spring—giving you more choice, even if the discounts aren’t as deep.
Final Thought
The 2025 spring market isn’t a frenzy—and it’s not a clearance sale either. It’s a smarter, more strategic market where preparation and pricing matter.
If you're buying or selling in Chatham County NC this spring, don’t rely on outdated headlines or social media buzz. Trust the data—and build your strategy on what’s really happening.
Ready to make a move in Chatham County?
Whether you're buying or selling, your strategy should match today’s market—not last year’s headlines. If you're curious about your home's value or exploring the right time to buy in Chatham County, let's talk.
📞 Schedule a quick consult
📍 Get a local pricing analysis
📊 Make your move with data on your side
Pittsboro REALTORs
Categories
Recent Posts

