Navigating the dynamic landscape of real estate can be an exhilarating yet intricate journey. In Pittsboro, NC, where the charm of small-town living meets the sophistication of modern properties, understanding the market's pulse is crucial for both buyers and sellers. In this comprehensive analysis, we delve into the heart of our local real estate market, examining key metrics from November 2022 to October 2023. From active and pending listings to the nuanced shifts in median list prices and sales ratios, our data-driven approach provides valuable insights into the trends shaping our community's housing market. Whether you're contemplating selling your home or in the market for a new one, this article offers an in-depth look at the current market conditions, including the median sale price per square foot and the fluctuating dynamics of properties sold and listed in our area.
Current Market Condition
$590,940
Median List Price
View Properties for Sale Find Out Your Home Value
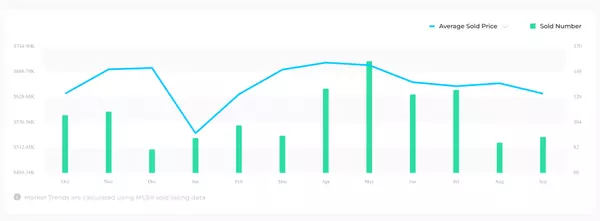
The median sale/list price for the given data varies between $448,990.5 and $655,280.0. The median price for the first data set increases from November 2022 to March 2023 and then decreases gradually in the following months, whereas the median price for the second data set keeps fluctuating but remains relatively stable overall.
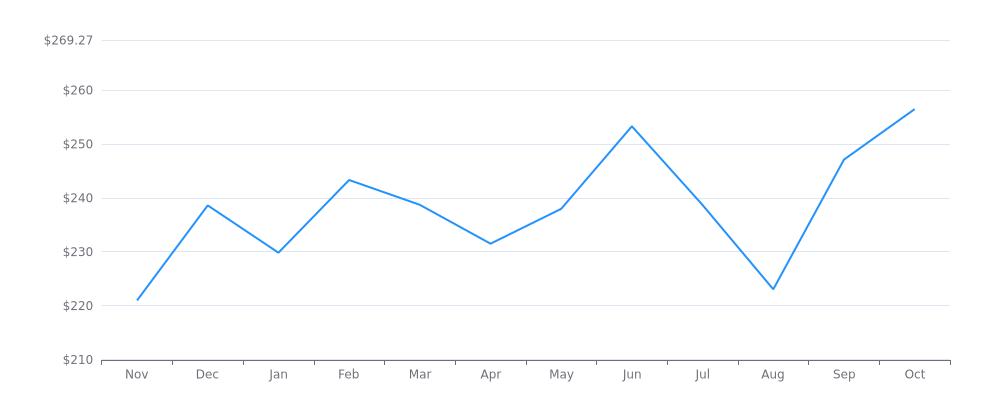
The median sale price per square foot of real estate is expected to increase steadily from November 2022 to October 2023, with the highest spike occurring in June 2023 at $253.256 per square foot. The lowest recorded median sale price per square foot is in August 2023, at $223.015.
Median Sale Price per Square Foot
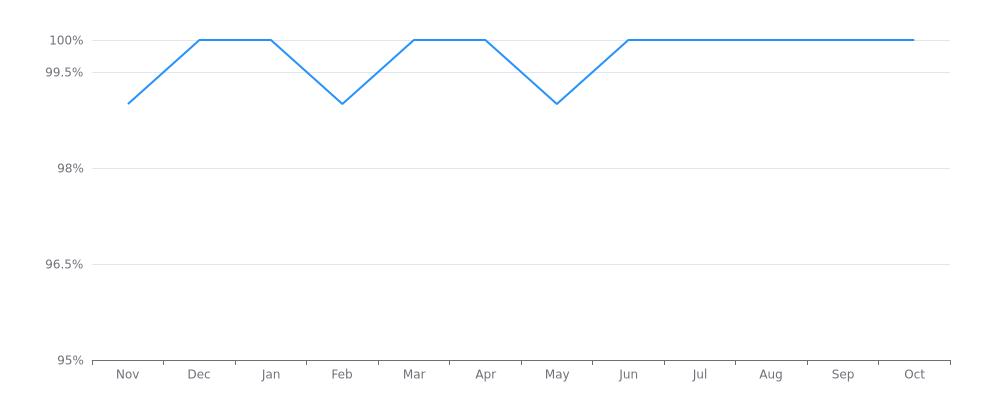
The median sale price to list price ratio varies throughout the year, with some months having a ratio of 1.0, indicating that the median sale price was equal to the list price, while other months had slightly lower ratios. However, overall, the ratio seems to be stable over the course of the year, with no significant fluctuations.
Median Sale Price to List Price Ratio
The data shows the number of properties sold and listed each month from November 2022 to October 2023. The number of properties sold increased steadily from 36 in November 2022 to 80 in June 2023, before declining slightly to 53 in October 2023. The number of properties listed peaked in May 2023 at 74 and ranged from 30 to 74 throughout the year.
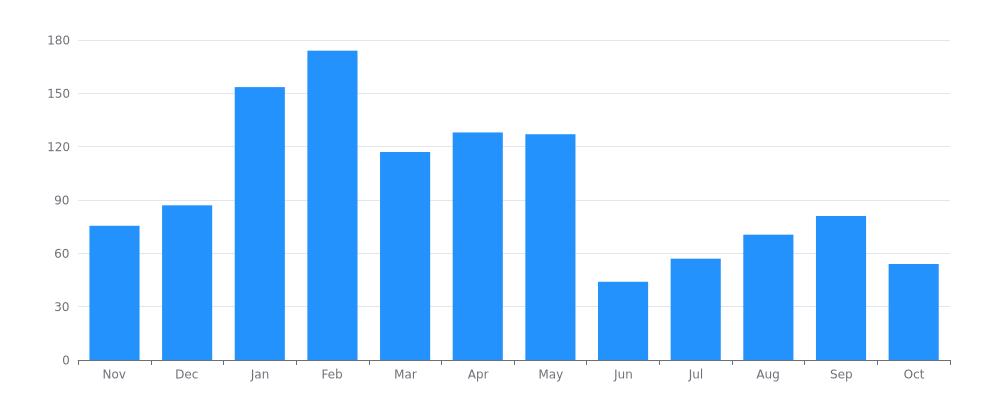
The median days on market for homes in November 2022 was 75.5, but it increased to 174.0 in February 2023, and then decreased to 54.0 in October 2023. Additionally, June 2023 had the lowest median days on market at 44.0.
Our journey through Pittsboro's real estate market from November 2022 to October 2023 reveals a vibrant and ever-evolving landscape. Key trends, such as the increase in median sale price per square foot and the changing dynamics of properties sold, highlight the market's resilience. This analysis equips both buyers and sellers with valuable insights, aiding them in making informed decisions in our dynamic housing market. Understanding these patterns is essential for navigating the real estate world with confidence and strategy.

